
5 Methodological Issues That Can Undermine Real-World Health Studies
A design limitation can quietly weaken what a real-world health study can tell us: an estimated effect may reflect confounding, comparison groups may not be comparable, or a significant result may be one chance finding among many.
Here is the uncomfortable part: a study can collect data carefully and run its analysis cleanly yet still be unable to answer its research question as intended. Design decisions can waste funding and staff time and, in some studies, expose participants unnecessarily.
Below are five examples of methodological issues that can affect the validity and interpretation of findings from real-world health studies. Each is best addressed before prospective observations are collected or, when using existing records, before the analytic cohort is assembled and outcomes are examined.
Mistake 1 — Ignoring confounding (common causes of exposure and outcome)
What it is. A confounder is a common cause of the exposure (X) and outcome (Y) (Lash et al., 2021; Porta, 2026). It may be measured or unmeasured. If a relevant confounder is absent from the data, the study faces unmeasured confounding; if confounders are poorly measured or inadequately handled, residual confounding may remain. In a simple example, Z influences both X and Y, so some of their observed association may reflect Z rather than an effect of X on Y.
Why it matters. Measured confounders can be addressed through design and appropriate analysis when they are measured well and the assumptions hold. Unmeasured confounding cannot be adjusted for directly from the study data; sensitivity analyses can assess how strongly it could affect an estimate, but cannot remove it.
Example. HRT illustrates both confounding concerns and why the comparison needs qualification. Some observational studies reported lower coronary heart disease (CHD) risk among postmenopausal hormone-therapy users. In contrast, the Women's Health Initiative (WHI) randomized trial of one combined estrogen–progestin regimen found increased CHD risk in its enrolled population. The findings do not establish a universal effect for every formulation or patient group (Prentice et al., 2005; Rossouw et al., 2002). Women who later used estrogen replacement also differed from nonusers in some characteristics before treatment began; those differences can confound observational estimates if they influence both treatment use and heart disease and are not adequately measured and handled (Matthews et al., 1996).
Catch it at the design stage. Draw a causal diagram (DAG) to identify plausible common causes of exposure and outcome. For each, specify whether it can be measured and how it will be accounted for. If a relevant confounder cannot be measured adequately, disclose the limitation and plan sensitivity analyses. Unacknowledged residual confounding weakens causal interpretation.
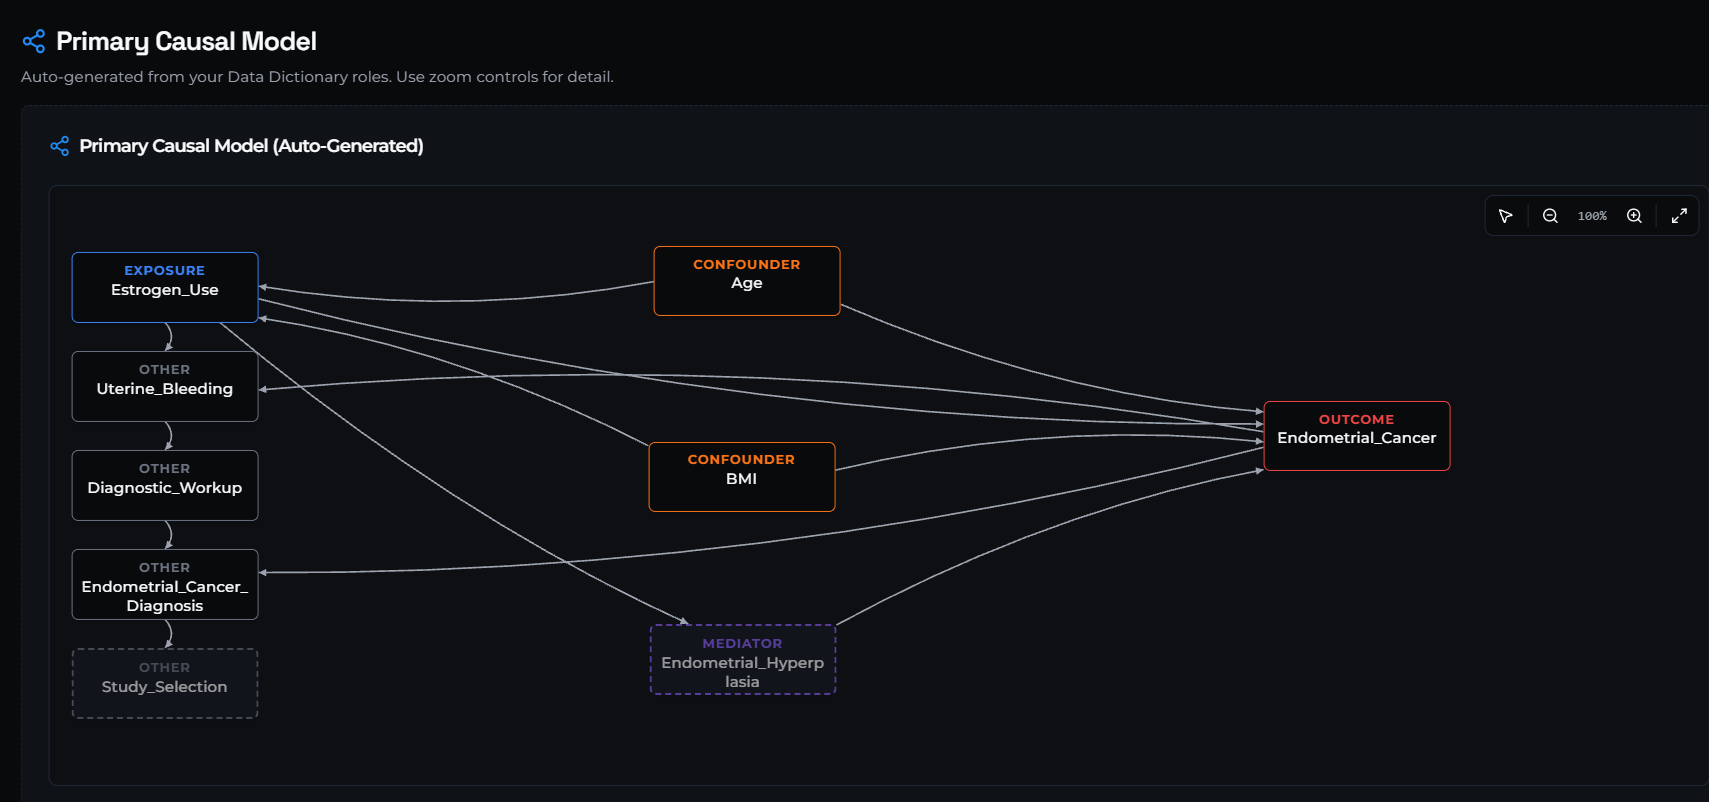
Studio generates this diagram from variable roles; it represents assumptions to review, not proof of causal relationships.
Mistake 2 — Selection bias (and the healthy-user effect)
What it is. The people in your data differ systematically from the population you claim to describe. Healthier, more engaged people are easier to recruit, stay longer, and appear more often in records; sicker people disappear—or never enter at all.
Why it matters. If entry into the dataset or remaining under observation differs systematically between groups, the observed contrast may reflect those selection processes as well as treatment. Weighting or selection models can sometimes reduce selection bias when the factors driving selection are measured, the models are appropriate, and there is adequate overlap. If important factors are unmeasured or comparable observations are absent, bias may remain.
Example. In claims data, people who fill statin prescriptions also see doctors regularly, get screened more, and manage their conditions. Compare them with people who avoid doctors entirely and the statin group looks miraculous—whether or not the drug does anything at all. Who is in your data decides what your data says.
Catch it at the design stage. Write eligibility rules before enrollment or, for existing records, before assembling the analytic cohort; then enumerate every way someone can enter or leave the sample. For observational data, state the source population and reason through how each comparison could be distorted by who ends up in it. If selection is unavoidable, plan for it—don't discover it.

Eligibility criteria are one part of selection-bias planning; also define the source population and how people enter or leave the analytic cohort.
Mistake 3 — Data dredging (multiple comparisons)
What it is. Testing enough subgroups, outcomes, or time windows until random noise looks significant. For example, if all 200 null hypotheses are true and each test has a 5% false-positive rate, 10 false positives are expected on average—not exactly 10 in every study. How often at least one appears depends on how the tests are related. Selecting the most striking result after searching all the tests, without accounting for that search, makes its nominal p-value overstate the evidence (Bender & Lange, 2001).
Why it matters. A nominal p-value describes one test; it does not account for searching across many tests and selecting the strongest result. That selection can increase false-positive risk and exaggerate the estimated effect. Treat post-hoc findings as exploratory until independently confirmed; otherwise, chance results may be mistaken for actionable evidence (Bender & Lange, 2001).
Example. A team mines an EHR cohort for "factors associated with readmission," tests dozens of predictors, and reports the strongest as the primary finding—a perfectly executed study of random variation.
Catch it at the design stage. Fix the primary outcome and primary analysis in the protocol before examining outcome data, and flag everything else as exploratory. If hypothesis generation is your goal, pre-commit to a multiplicity correction and report every test you ran, not just the winners.
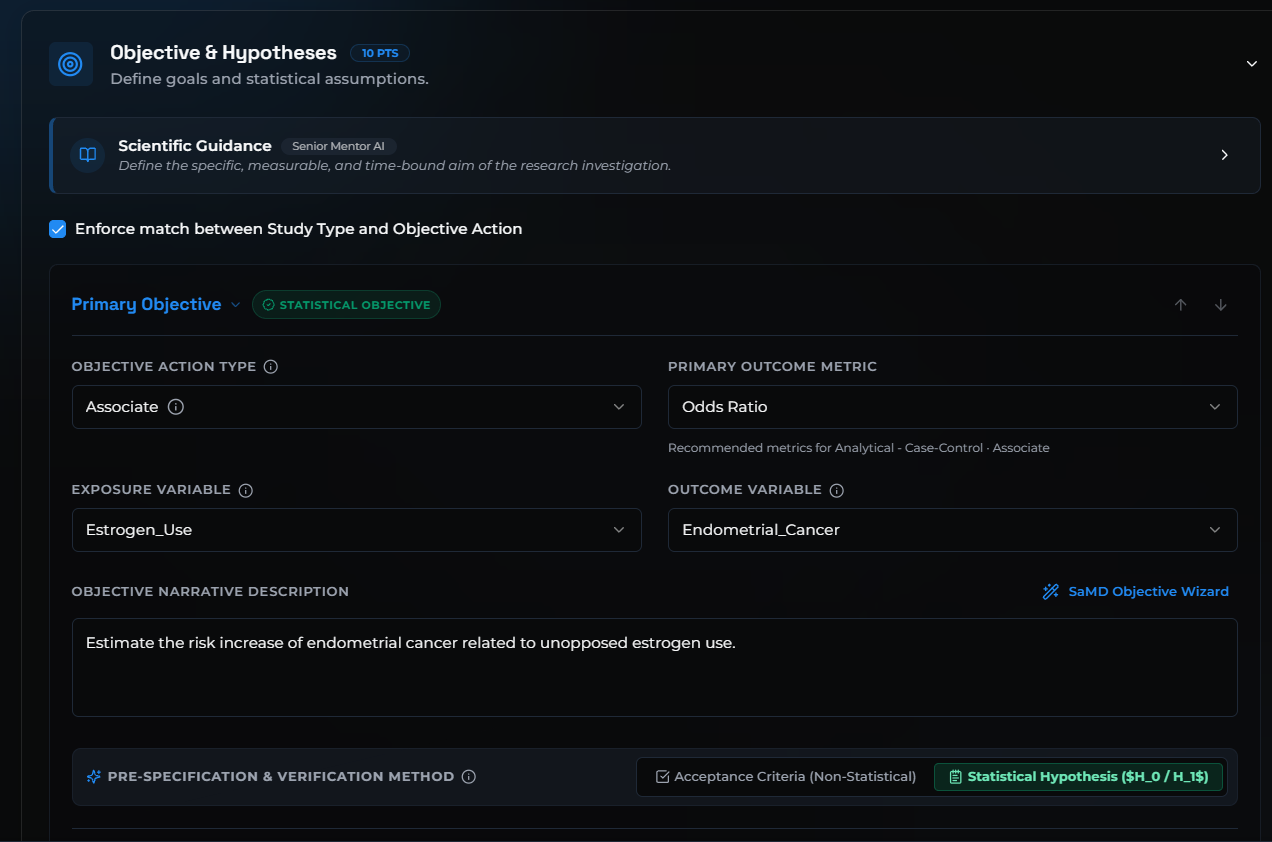
Pre-specifying the objective and primary outcome helps distinguish planned from exploratory analyses.
Mistake 4 — Immortal time bias (and mishandled time-varying exposure)
What it is. When treatment can begin after follow-up starts, defining patients as "treated" because they receive treatment at any time later means they must survive long enough to start. For a mortality outcome, the time before initiation is therefore guaranteed survival time for the eventual-treated group, even though those patients had not yet received treatment (Suissa, 2008).
Why it matters. If that pre-treatment time is counted as exposed, while deaths before treatment initiation are counted in the untreated group, the treated group gets a survival advantage by construction. A treatment can look protective even when it has no effect.
Example. Suppose follow-up begins at diagnosis and "treated" means "started the drug at some point during follow-up." Someone who starts six months later contributes those first six months to the treated group if exposure is classified from baseline; patients who die before starting can only be counted in the untreated group. That misclassification can create an apparent survival benefit.
Catch it at the design stage. Align eligibility, assignment to a treatment strategy, and the start of follow-up at a common time zero (Hernán et al., 2016). Define precisely when exposure begins. If treatment starts after baseline, represent actual initiation as a time-varying exposure so person-time before the first dose remains unexposed. If the question allows an initiation window (a "grace period"), define it and the treatment strategy in advance, and use a design and analysis that handle that window—for example, target-trial emulation with cloning, censoring, and weighting. A per-protocol analysis by itself is not a fix: if follow-up is censored when someone deviates from the specified strategy, account for the resulting informative censoring.
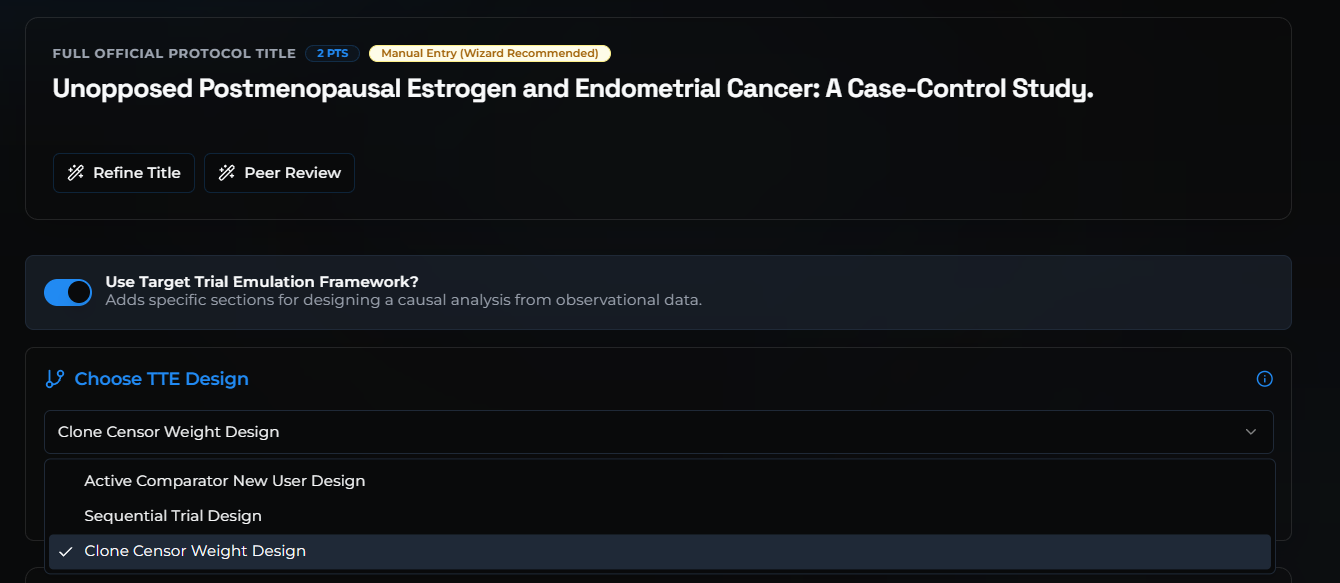
The clone-censor-weight design is one approach for treatment strategies with a grace period; select methods that fit the study question and assumptions.
Mistake 5 — Undisclosed, outcome-informed protocol changes
What it is. Protocols may need legitimate amendments. The problem is changing objectives, outcomes, exclusions, or analysis choices after seeing results, then presenting the new choices as though they were prespecified. A time-stamped original plan and a transparent amendment log help readers distinguish confirmatory tests from exploratory analyses (Nosek et al., 2018).
Why it matters. When analysis choices are influenced by observed results but reported as prespecified, selective reporting can make the evidence look stronger than it is. Preregistration supports transparency; it does not prevent amendments or make clearly labeled post-hoc analyses invalid.
Example. A team preregisters one primary outcome. After finding it null, they switch to a different outcome that appears more clinically meaningful. The new outcome may be scientifically relevant, but presenting it as the planned primary outcome hides that the choice followed the result.
Catch it at the design stage. Before prospective enrollment—or before outcome-aware analysis of existing records—pre-register the initial plan publicly or save a time-stamped internal version. Log later amendments with dates and reasons; label analyses prompted by observed results as exploratory. Pre-specification strengthens confirmatory claims; justified amendments and post-hoc exploration remain useful when transparently reported.
Design-stage checklist for causal comparisons
This checklist is intended for observational studies estimating causal effects. Apply the checks relevant to the study design and data source; document why an item does not apply. Resolve applicable issues before prospective data collection—or, for existing records, before assembling the analytic cohort or examining outcomes.
- ☐ Confounding assessed. DAG drawn; measured confounders appropriately accounted for; important unmeasured or poorly measured confounding acknowledged and assessed with sensitivity analysis.
- ☐ Selection mapped. Eligibility rules written before enrollment or analytic-cohort construction; every entry and exit path enumerated.
- ☐ Analysis specified. Primary outcome and analysis plan set before outcome data are examined; other analyses labeled exploratory.
- ☐ Time aligned. Eligibility, treatment strategy, and follow-up share a time zero; pre-initiation person-time is not counted as exposed without an explicit strategy that accounts for it.
- ☐ Plan transparent. Initial protocol and analysis plan publicly registered or internally time-stamped before prospective enrollment or outcome-aware analysis of existing records; amendments dated and explained; post-hoc analyses labeled exploratory.
Structured design checks and expert review
Some design questions can be addressed through structured protocol development and rule-based feedback; others benefit from expert epidemiological review.
- For researchers: build your protocol in Studio. The SPDE guides objectives and study-design choices, while the Scientific Validity Linter flags specific methodological rules as you write. Try it free at studio.outcomeproject.com.
- For teams that need a human second set of eyes: Outcome Squad offers epidemiological review—target-trial emulation, causal inference from real-world data, and bias audits. Reviews can be scoped to the study question and design: outcomeproject.com/services/outcome-squad.
The AI assists; the deterministic checks decide. Validation you can trace, not a black box you must trust.
References
- Lash TL, VanderWeele TJ, Haneuse S, Rothman KJ. Modern Epidemiology. 4th ed. Wolters Kluwer; 2021.
- Porta M, editor. A Dictionary of Epidemiology. 7th ed. Oxford University Press; 2026.
- Prentice RL, Langer RD, Stefanick ML, et al. Combined postmenopausal hormone therapy and cardiovascular disease: toward resolving the discrepancy between observational studies and the Women's Health Initiative clinical trial. American Journal of Epidemiology. 2005;162(5):404–414. https://doi.org/10.1093/aje/kwi223
- Rossouw JE, Anderson GL, Prentice RL, et al. Risks and benefits of estrogen plus progestin in healthy postmenopausal women: principal results from the Women's Health Initiative randomized controlled trial. JAMA. 2002;288(3):321–333. https://doi.org/10.1001/jama.288.3.321
- Matthews KA, Kuller LH, Wing RR, Meilahn EN, Plantinga P. Prior to use of estrogen replacement therapy, are users healthier than nonusers? American Journal of Epidemiology. 1996;143(10):971–978.
- Bender R, Lange S. Adjusting for multiple testing—when and how? Journal of Clinical Epidemiology. 2001;54(4):343–349. https://doi.org/10.1016/S0895-4356(00)00314-0
- Suissa S. Immortal time bias in pharmaco-epidemiology. American Journal of Epidemiology. 2008;167(4):492–499. https://doi.org/10.1093/aje/kwm324
- Hernán MA, Sauer BC, Hernández-Díaz S, Platt R, Shrier I. Specifying a target trial prevents immortal time bias and other self-inflicted injuries in observational analyses. Journal of Clinical Epidemiology. 2016;79:70–75. https://doi.org/10.1016/j.jclinepi.2016.04.014
- Nosek BA, Ebersole CR, DeHaven AC, Mellor DT. The preregistration revolution. Proceedings of the National Academy of Sciences. 2018;115(11):2600–2606. https://doi.org/10.1073/pnas.1708274114